Standard deviation (abbreviated as SD) is a measure of the average amount of dispersion around the mean. It informs us how far the data is from the average value. A lower standard deviation expresses that the data points are clustered around the average whereas a higher SD shows that the data points are more spread out.
The standard deviation is a helpful tool to estimate the variability of data points about the mean. It is not only applied in statistics but is often used in finance and risk management to measure the uncertainty of investments.
In this article, we will learn more about the standard deviation by exploring its formulas and methods of calculation. This article will not be limited to theory but we will provide various numerical examples for you to make it easy to understand.
What is the Definition of Standard Deviation (or SD)?
In descriptive statistics, the standard deviation represents the average amount of spreading or scattering of data points around the mean. It is a method to measure the extent of variability within the data and the distance between individual data points.
If n is the number of data points in the data set and the data points are x1, x2 … xn, then the mean deviation is calculated as Σ (xi – x̄) ². However, solely summing the squared deviations cannot provide a sufficient measure of variation.
A lower mean of the squared differences from the average signifies that the data point xi is closer to mean x̄ and indicates a lesser amount of dispersion. Conversely, a higher sum implies that the data points are more widely spread out and less consistent.
We calculate Σ (xi – x̄) ²/n to obtain a more suitable measure of dispersion. This expression refers to variance and the square root of this variance is known as the standard deviation. This standard deviation serves as a more accurate indicator of the variability or spread present within the dataset.
Standard Deviation Calculation Formulas
The standard deviation is often used to estimate the variation and dispersion of the statistical data. It informs us how much the statistical data is spread or scattered from the mean. The standard deviation formula helps us to compute the deviation of all the data sets from its mean value.
There are two distinct formulas used to determine the standard deviation.
- Formula of Population Standard Deviation
- Formula of Sample Standard Deviation
Standard Deviation (σ) Formula For population
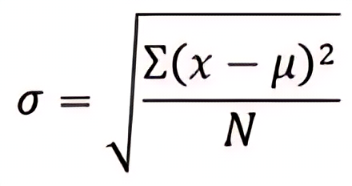
Notations for Population Standard Deviation:
- σ = Standard deviation of population data
- x = each value in the data set of the population
- µ = Mean for population
- N = Number of the data points in the data set
Standard Deviation (σ) Formula For sample
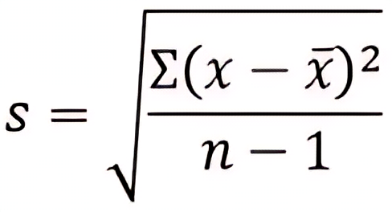
Notations for Sample Standard Deviation:
- s = SD for the sample data
- x = each value in the sample data
- x̄ = Mean of sample
- n = Number of observations in the population data set
Both SD formulas look similar but have a slight difference in their denominator. The denominator for the sample data is n – 1 whereas in the case of the population data is N. The denominator in the sample standard deviation formula initially had “n” in the denominator, but this result was incorrect. A correction was made by replacing n with n – 1 that provided accurate results
How to Determine the Standard Deviation?
Here are the steps to calculate the standard deviation for both sample and population data:
Step 1: Calculate the mean (average) of the data set by using the formula (mean = sum up of the observations/number of observations in the data set).
Step 2: Subtract the mean from each data point of the given data set. Find the square of all differences of the data value (xi – x̄)2.
Step 3: Sum up each squared difference obtained from step two.
Step 4: Divide the sum by the sample size minus one for the sample size. For population, divide the sum from Step 3 by the population size.
Step 5: Finally; take the positive square root and get the standard deviation.
Examples of Standard Deviation
Here are some examples to understand the explained step.
Example 1:
Calculate the standard deviation of the following sample data set
3, 4, 6, 7, and 10
Solution:
Step 1: Calculate the mean.
The Sample mean = x̄ = 3+4+6+7+10 / 5 = 6
Step 2: Subtract each data point from the mean and square the result i.e. (xi – x̄)2.
(3 – 6)2 = 9, (4 – 6)2 = 4, (6 – 6)2 = 0, (7- 6)2 = 1, (10 – 6)2 = 16
Step 3: Sum up each squared difference as Σ (xi – x̄) ² = 9 + 4 + 0 + 1 + 16 ⇒ 30
Step 4: Divide the sum by the sample size minus one to find [Σ (xi – x̄) ²/ (n – 1)].
30/4 = 7.5
Step 5: Take the square root to get the standard deviation.
s = sqrt [Σ (xi – x̄) ² / (n – 1)] = √7.5
= 2.74
Therefore, the SD of the sample data set is 2.74.
Example 2:
Find out the Standard deviation for given the population data set. 9, 12, 15, 18, 21
Step 1: Calculate the population mean.
µ = 9+12+15+18+21 / 5 ⇒ 15
Step 2: Subtract each data point from the mean and square the result i.e. (xi – µ)2.
(9 – 15)2 = 36, (12 – 15)2 = 9, (15 – 15)2 = 0, (18 – 15) 2 = 9, (21 – 15)2 = 36
Step 3: Sum up each of the squared differences.
36 + 9 + 0 + 9 + 36 = 90
Step 4: Divide the sum of the obtained squared difference 2 by the population size.
90/5 = 18
Step 5: Take the positive square root to get the standard deviation for the population.
Population SD = sqrt (Σ (xi – µ) ² / N) = √18 = 4.24
Therefore, the SD of the population data set is 4.24.
Conclusion
In this article, we explored the definitions of standard deviation in terms of both statistics and mathematics. We discussed different formulas for determining the standard deviation of samples and populations. We learned how to compute the samples and population SD with easy steps and then we solved examples to understand these steps practically.